
Class 10 Mathematics Chapter 2 - Polynomials Geometrical Meaning of the Zeroes of a Polynomial Notes and explanation
Geometrical Meaning of Zeros of Polynomial
The zeros of a polynomial are the values of x where the polynomial evaluates to zero. So we can say, they are the solutions to the equation P(x) = 0.
- X-Intercepts or Zeros: An x-intercept is a point on a graph where the curve (or line) crosses or touches the x-axis. Graphically, it's the point where the graph meets the horizontal line representing the x-values. It is often called roots, zeros or solutions as well depending on the context.
- X-Intercepts or Zeros Location on graph: The x-intercepts are the values of x where the graph either touch the x-axis and bounces off or crosses it completely.
- Y-Coordinate at an x-intercept or Zeros: The y-coordinate of the point is always zero because the x-axis has a y-coordinate of zero.
- Function Value of x-intercept or Zeros: An x-intercept is a point where the value of the function is zero. If we have a function P(x), an x-intercept is a point (a,0) where P(a)=0.
- Numbers of x-intercept or Zeros: The number of zeros a polynomial has corresponds to the number of times its graph intersects or touches the x-axis.
Zeros of a Polynomial
A value x = a is considered a zero of a polynomial, when we put in x = a into the polynomial, it is equals zero, i.e., P(x) = 0 at that point. The process of finding zero is basically the process of finding out the solutions of any polynomial equation.
Example 1: Let’s take a quadratic polynomial P(x) = x2 + 7x + 12
Solution : Begin by factoring P(x) = x2 + 7x + 12
x2 + 7x + 12
= x2 + (4x + 3x) + 12
= x2 + 4x + 3x + 12
= x ( x + 4 ) + 3 ( x + 4 )
= ( x + 3 ) ( x + 4 ) (factor of P(x))
To find the zeros of the polynomial P(x), we set P(x) equal to zero
P(x) = 0
( x + 3 ) ( x + 4 ) = 0
By solving above equation we get
x + 3 = 0 → x = — 3
x + 4 = 0 → x = — 4
So, Zero of the polynomial P(x) are x = — 3 and x = — 4 which is determined as solutions of equation.
Example 2: Let’s take another cubic polynomial P(x) = x3 + 6x2 + 9x
Solution : Begin by factoring P(x) = x3 + 6x2 + 9x
P(x) = x3 + 6x2 + 9x
P(x) = x (x2 + 6x + 9) ------------------- (1)
Factoring equation x2 + 6x + 9
= x2 - 3x - 3x – 9
=x ( x - 3) – 3 ( x – 3 ) = ( x – 3 )2 ----------------- (2)
Putting value from equation (2) to equation (1)
P(x) = x ( x – 3 )2
To find the zeros of the polynomial P(x), we set P(x) equal to zero
P(x) = 0
x ( x – 3 )2 = 0
Above equation has two factor which is equal to zero, first is x = 0 and second is ( x – 3 )2 = 0
So, we can solve each separately.
Fist factor x equal to zero : x = 0 ----------------- (3)
Second factor ( x – 3 )2 equal to Zero :
( x – 3 )2 = 0
By taking square root of both side
√( x – 3 )2 = √0
x - 3 = 0 ----------------------- (4)
By solving above (3) and (4) equation we get
x = 0 → x = 0
x - 3 = 0 → x = 3
So, Zero of the cubic polynomial P(x) are x = 0 and x = 3 which is determined as solutions of equation.
The value of a polynomial
The value of a polynomial is what we get when we put a number into the polynomial's formula and calculate the result.
If we have a polynomial P(x), the value of the polynomial at a point x = k is denoted as P(k) and we can say x replaced by k.
The general process for getting value of a polynomial is:
- Start with the polynomial P(x)
- Replace x with the value of k.
- Calculate the result.
Example : Let’s take a polynomial P(x) = 2x2 —3x + 1 and we want to find value of P(x) when x = 4
Solution :
1. Start with P(x) = 2x2 —3x + 1
2. Replace x with 4 → P(4) = 2(4)2 — 3(4) + 1
3. Calculate the result → P(4) = 2(16) — 12 + 1 → 32—12 + 1 → 21
So, value of P(x) = 21
Equations representation on a Graph
In graphical representation, any equation can be turned into a Cartesian plane. This graph shows points with x and y coordinates that make the equation true. An equation is like a rule for how x and y should be related on a graph.
Take the equation y=x as an example. It creates a straight line on the graph. This line links points where both the x and y values are the same, like (1,1), (2,2), and so on.

- Slope: The slope of the line is equal to 1. This means that for every 1 unit we move to the right (in the positive x-direction), we move up 1 unit (in the positive y-direction). So, it has a slope of 1, which can be written as 1/1.
- Intercepts: The line crosses the y-axis at the point (0,0). This point is called the origin. It also crosses the x-axis at the point (0,0). So, the line passes through the origin.
- Direction: The line goes through the origin and extends infinitely in both directions. It has the same slope and direction no matter how far we extend it.
- Shape: The line is perfectly straight by forming a 45-degree angle with respect to the x-axis. It has a constant slope throughout its length.
- Equation: The equation y = x means that for any value of x, we can find the corresponding y value by simply setting y equal to x. This equation describes all the points on the line.
- Positive Slope: Because the slope is positive, the line slants upwards from left to right, which means as we move to the right along the x-axis, the y-values increase.
Geometrical Representation of a Linear Polynomial
The general form of a linear polynomial is:
P(x) = ax + b
Where:
P(x) = represents the function.
A = the coefficient of the variable "x"
X = the variable.
B = the constant term
- The graph of a linear polynomial is a straight line. It cuts the X-axis at exactly one point.
- A geometrical representation of a linear polynomial in a two-dimensional Cartesian coordinate system is a straight line.
- The equation P(x) = ax + b represents a line that slopes upward or downward depending on the value of "a" and it intersects the y-axis at the point (0, b).
We can interpret this geometrically as below:
Slope (a):
The coefficient "a" determines the slope of the line.
If "a" is positive, the line slopes upward to the right, and if "a" is negative, the line slopes downward to the right.
Y-Intercept (b):
The constant term "b" represents the y-coordinate where the line intersects the y-axis. It's the point (0, b) on the graph.
Insert figure
Method:
Step-1: Select Values for "x":
- Choose a few values for the variable "x".
- These values will determine the corresponding values of "P(x)".
- You can select any values, but it's helpful to choose values that are easy to work with. Common choices include -2, -1, 0, 1, and 2.
Step-2: Calculate "P(x)":
- For each value of "x" calculate the corresponding value of "P(x)" by using the given linear polynomial equation.
- Put each value of "x" into the equation "P(x) = ax + b" and compute "P(x)".
Step-3: Create Ordered Pairs:
- For each pair of "x" and "P(x)" values, create an ordered pair (x, P(x)).
- These ordered pairs represent points on the graph of the linear polynomial.
Step-4: Plot the Points:
- On a coordinate plane (with x and y axes), plot each ordered pair (x, P(x)) as a point.
- The x-coordinate corresponds to the value of "x" and the y-coordinate corresponds to the value of "P(x)".
Step-5: Connect the Points:
- After plotting the points, connect them with a straight line.
- This line represents the graph of the linear polynomial.
Example-1: P(x) = 2x + 3
Solution:
Let we choose few value for “x” is —2, —1, 0, 1, and 2
- When x = —2: P(—2) = 2×(—2) + 3 = —4 + 3 = —1
- When x = —1: P(—1) = 2× (—1) + 3 = —2 + 3 = 1
- When x = 0: P(0) = 2×0 + 3 = 0 + 3 = 3
- When x = 1: P(1) = 2×1 + 3 = 2 + 3 = 5
- When x = 2: P(2) = 2×2 + 3 = 4 + 3 = 7
Now, create the ordered pairs:
(—2, —1), (—1, 1), (0, 3), (1, 5), (2, 7)
Plotting above ordered pairs on a graph paper as per given figure:

It represent a line with a slope of 2 (it rises 2 units for every 1 unit to the right) and intersects the y-axis at (0, 3).
Example-2: P(x) = -0.5x + 1
Solution:
Let we choose few value for “x” is —2, 0 and 2
- When x = —2: P(—2) = —0.5×(—2) + 1 =1 + 1 = 2
- When x = 0: P(0) = —0.5×(0) + 1 =0 + 1 = 1
- When x = 2: P(2) = —0.5×(2) + 1 =—1 + 1 = 0
Now, create the ordered pairs:
(—2, 2), (0, 1), (2, 0)
Plotting above ordered pairs on a graph paper as per given figure:

Example-3: P(x) = 4x – 2
Solution:
Let we choose few value for “x” is —2, 0 and 2
- When x = —2: P(—2) = 4×(—2) — 2 =—8— 2 = —10
- When x = 0: P(0) = 4×(0) — 2 =0 — 2 = —2
- When x = 2: P(2) = 4×(2) — 2 =8 — 2 = 6
Now, create the ordered pairs:
(—2, —10), (0, —2), (2, 6)
Plotting above ordered pairs on a graph paper as per given figure:

Geometrical Representation of a Quadratic Polynomial
The general form of a quadratic polynomial is:
P(x) = ax2 + bx + c
Where:
P(x) = represents the function
a, b and c = coefficients with a≠0
x = the variable
- A quadratic polynomial is a polynomial of degree 2, which means it has one variable raised to the second power.
- It is graphically represented as parabolas.
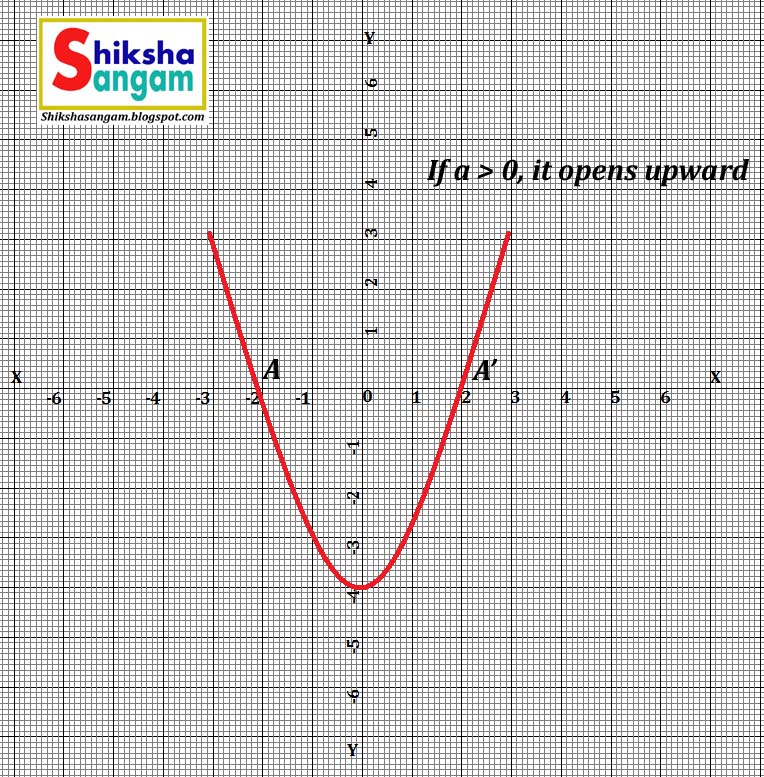
- The shape of the graph look like a "U" and whether it opens upward or downward depends on the value of 'a' in the quadratic polynomial ax2 + bx + c, If a > 0, it opens upward; if a < 0, it opens downward.
- The vertex of the parabola is a critical point where it changes direction.
- The vertex can be found using the formula: xvertix = —b/2a
- The axis of symmetry is a vertical line passing through the vertex with the equation x = xvertix
- The zeroes of a quadratic polynomial are the solutions to the equation P(x) = 0 where P(x) = ax2 + bx + c.
- These zeroes correspond to the x-coordinates where the parabola intersects the x-axis.
Example-1 (with an Upward-Opening Parabola)
P(x) = x2 — 3x + 2
Solution: Let we choose few value for “x” is —5, —4, —3, —2, —1, 0, 1, 2, 3, 4, 5 and 6
- When x = —5: P(—5) = (—5)2 — 3(—5) + 2 = 25 + 15 + 2 = 42
- When x = —4: P(—4) = (—4)2 — 3(—4) + 2 = 16 + 12 + 2 = 30
- When x = —3: P(—3) = (—3)2 — 3(—3) + 2 = 9 + 9 + 2 = 20
- When x = —2: P(—2) = (—2)2 — 3(—2) + 2 = 4 + 6 + 2 = 12
- When x = —1: P(—1) = (—1)2 — 3(—1) + 2 = 1 + 3 + 2 = 6
- When x = 0: P(0) = 02 — 3(0) + 2 = 0 — 0 + 2 = 2
- When x = 1: P(1) = 12 — 3(1) + 2 = 1 — 3 + 2 = 0
- When x = 2: P(2) = (2)2 — 3(2) + 2 = 4 — 5 + 2 = 0
- When x = 3: P(3) = (3)2 — 3(3) + 2 = 9 — 9 + 2 = 2
- When x = 4: P(4) = (4)2 — 3(4) + 2 = 16 — 12 + 2 = 6
- When x = 5: P(5) = (5)2 — 3(5) + 2 = 25 — 15 + 2 = 12
- When x = 6: P(6) = (6)2 — 3(6) + 2 = 36 — 18 + 2 = 20
Now, create the ordered pairs:
x | -5 | -4 | -3 | -2 | -1 | 0 | 1 | 2 | 3 | 4 | 5 | 6 |
P(x) | 42 | 30 | 20 | 12 | 6 | 2 | 0 | 0 | 2 | 6 | 12 | 20 |
Plotting above ordered pairs on a graph paper as per given figure:

Find the Vertex:
P(x) = x² — 3x + 2
a = 1, b = —3, c = 2
Use Formula: xvertix = —b/2a
Putting Value : xvertix = —[—3/2(1)] = 3/2
Put this value back into the equation to find “y” vertex.
yvertex = P(3/2) = (3/2)² — 3(3/2) + 2 = ¼
Example-2 (with a Downward-Opening Parabola)
P(x) = —2x2 + 4x + 1
Solution: Let we choose few value for “x” is —2, —1, 0, 1, 2 and 3
- When x = —2: P(—2) = —2(2)2 + 4(—2) + 1 = —2(4) — 8 + 1 = — 8 — 8 + 1 = —15
- When x = —1: P(—1) = —2(—1)2 + 4(—1) + 1 = —2(1) — 4 + 1 = — 2 — 4 + 1 = —5
- When x = 0: P(0) = —2(0)2 + 4(0) + 1 = 0 + 0 + 1 = 1
- When x = 1: P(1) = —2(1)2 + 4(1) + 1 = —2(1) + 4 + 1 = — 2 + 4 + 1 = 3
- When x = 2: P(2) = —2(2)2 + 4(2) + 1 = —2(4) + 8 + 1 = — 8 + 8 + 1 = 1
- When x = 3: P(3) = —2(3)2 + 4(3) + 1 = —2(9) + 12 + 1 = — 18 + 12 + 1 = —5
Now, create the ordered pairs:
X | -2 | -1 | 0 | 1 | 2 | 3 |
P(x) | -15 | -5 | 1 | 3 | 1 | -5 |
Plotting above ordered pairs on a graph paper as per given figure:

The coefficient of x² is negative -2, so the parabola opens downward.
Find the Vertex:
P(x) = —2x2 + 4x + 1
a = —2, b = 4, c = 1
Use Formula: xvertix =— b/2a
Putting Value : xvertix = —[4/2(—2)] = 1
Put this value back into the equation to find “y” vertex.
yvertex = P(1) = —2(1)² + 4(1) + 1 = 3
So, Vertex are (1 , 3)
Three Possible Cases for Zeroes:
Case (i):
The graph cuts the x-axis at two distinct points A and A', where A and A' are the two zeroes of the quadratic polynomial. As per given figure:

Case (ii):
The graph cuts the x-axis at exactly one point, meaning A and A' from Case (i) coincide into one point A. The x-coordinate of A is the only zero. As per given figure:


Case (iii):
The graph is entirely above or below the x-axis and it does not intersect the x-axis. Therefore, the quadratic polynomial has no zeroes in this case.


A polynomial of degree 2 (quadratic polynomial) can have at most two zeroes.
Geometrical Representation of a Cubic
Polynomial
A General form of a cubic polynomial is:
P(x) = ax² + bx² + cx + d
Characteristics:
Cubic Curve:
- A cubic polynomial has a degree of 3, which means the highest power of “x” in the equation is 3.
- The cubic curve is characterized by its S-like shape, which can have one or two curves depending on the coefficients of the polynomial. Shape can look like a stretched-out "S" or an inverted "S" or even a combination of both.
Number of Zeroes:
- A cubic polynomial can have up to three real zeroes.
- The zeroes correspond to the x-values where the curve intersects the x-axis.
Turning Points:
- A cubic polynomial has one or two turning points. These are the locations on the curve where the slope changes from positive to negative or vice versa.
- The turning points may be local minimum or maximum, depending on the coefficients of the polynomial.
Symmetry:
- The cubic curve may have symmetry about the y-axis, the x-axis or neither, depending on the coefficients.
- The symmetry affects the orientation and direction of the curve.
End
Behavior:
- The end behavior of the cubic curve depends on the sign of the leading coefficient a.
- If a > 0, the curve starts from the bottom-left and extends to the top-right (positive end behavior).
- If a < 0, the curve starts from the top-left and extends to the bottom-right (negative end behavior).
Complex Roots:
- In some cases, a cubic polynomial may have complex roots, leading to no real x-intercepts. This results in the entire curve lying above or below the x-axis.
Fitting Data Points:
- People use cubic curves to draw or approximate lines on a graph that best match their data points. It's a useful tool for showing how things change over time.
- Some types of the geometrical representation of cubic polynomials:
Types of Cubic Functions:
Cubic Function with One Turning Point:
- In these type cubic functions, the graph has an S-like shape with a single local minimum turning point.
- Example : P(x) = x³ —3x² + 3x
Cubic Function with Two Turning Points:
- In these type cubic functions, the graph has two local minimum turning points.
- Example: P(x) = —x³+3x²—3x
Cubic Function with Complex Roots:
- In these type cubic functions, the graph does not intersect the x-axis because it has no real turning points. All of its roots are complex.
- Example: P(x) = x³ + 1
Cubic Function with Symmetry:
- In these type cubic functions, the graph is symmetric about the y-axis and it changes direction at the origin.
- Example: P(x) = x³—x
Cubic Function with One Real Root:
- In these type cubic functions, the graph intersects the x-axis at this point and changes from falling to rising. It means this function has one real root.
- Example: P(x) = x³—4x²+5x—2
Cubic Function with One Real Root
and Complex Roots:
- In these type cubic functions, the graph has
one turning point and intersects the x-axis at the real root.
- Example: P(x) = x³—2x²+2x—1
Relationship between
Polynomial Degree and the Number of Zeroes:
- For a polynomial p(x) of degree n, where n represents the highest power of x in the polynomial:
- The graph of the corresponding equation y = p(x) may intersect the x-axis at certain points.
- The number of points where the graph intersects the x-axis is at most n.
- Therefore, a polynomial of degree n has at most n zeroes.
Example-1: Let’s take polynomial
P(x) = x³—4x
Solution : Create some the ordered pairs as given below table.
|
x |
—2 |
—1 |
0 |
1 |
2 |
|
P(x) = x³—4x |
0 |
3 |
0 |
—3 |
0 |
Plotting above ordered pairs on a graph paper as per given figure:

- So, above polynomial represent a cubic function and make a cubic shape which is categorized as “S” shape.
- The curve has one minimum local turning point (0,0) where curve change from decreasing to increasing.
- This polynomial has three real zeroes x = 0, x = 2, x = —2.
Example-2: Let’s take polynomial P(x) = x³
Solution : Create some
the ordered pairs as given below table.
- P(—2) = (—2)³ = —8
- P(—1) = (—1)³ = —1
- P(0) = (0)³ = 0
- P(1) = (1)³ = 1
- P(2) = (2)³ = 8
|
X |
—2 |
—1 |
0 |
1 |
2 |
|
P(x) = x³ |
—8 |
—1 |
0 |
1 |
8 |
Plotting above ordered pairs on a graph paper as per given figure:

- The polynomial P(x) = x³ represents a cubic function.
- The graph of this function is a curve with a single turning point at the origin (0,0) where it changes from decreasing to increasing.
- As x moves further to the right or left on the x-axis, the curve either rises or falls without bound.
- The graph resembles an "S" shape, where it starts in the lower-left quadrant, passes through the origin, and extends to the upper-right quadrant. It continues in these directions indefinitely.
Example-3: Let’s take polynomial
P(x) = x³—x²
Solution : Create some
the ordered pairs as given below table.
- P(—2) = (—2)³—(—2)² =(— 8) — (— 4) = — 4
- P(—1) = (—1)³—(—1)² = — 1 — 1 = — 2
- P(0) = (0)³—(0)² = 0
- P(1) = (1)³—(1)² = 0
- P(2) = (2)³—(2)² = 8 — 4 = 4
|
X |
—2 |
—1 |
0 |
1 |
2 |
|
P(x) = x³—x² |
—4 |
—2 |
0 |
0 |
4 |
Plotting above ordered pairs on a graph paper as per given figure:

- The polynomial x³ — x² has only zeroes are 0 and 1.
No comments:
Post a Comment
If you have any questions or uncertainties, please don't hesitate to ask.